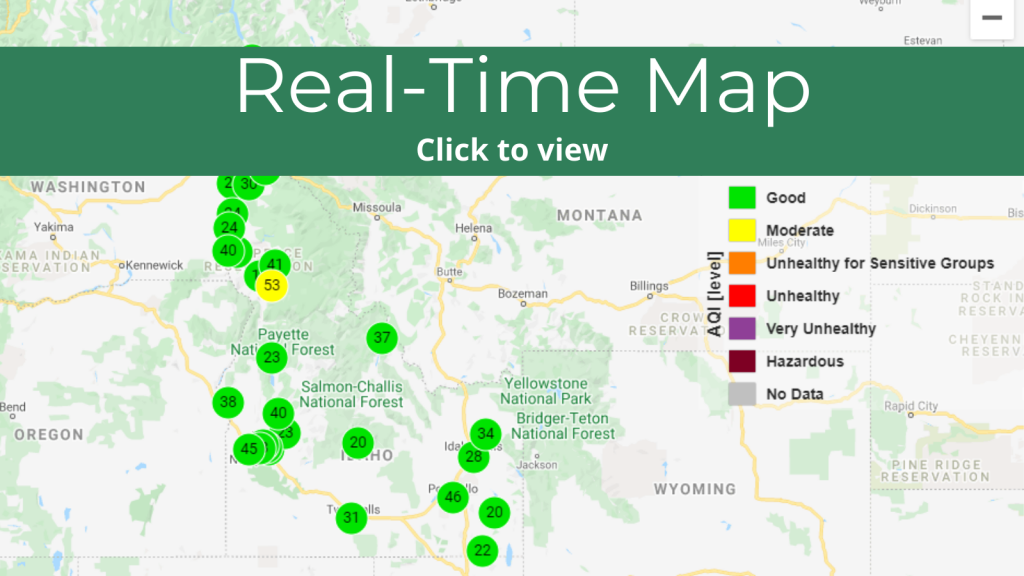
DEQ collects hourly air quality data from over 30 monitoring stations and converts the information into a real-time Air Quality Index (AQI) known as NowCast. NowCast takes a weighted average of the hourly air quality data and provides a real-time AQI. It uses a longer average during periods of stable air quality and a shorter average when air quality is rapidly changing such as during a wildfire. NowCast is designed to respond to current conditions and help people make real-time health-based decisions.
Our real-time map displays AQI information from each monitoring site. When multiple pollutants are measured at a site, the map displays the highest AQI value. You can select and expand each dot for site and monitor-specific information and navigate the tabs for reports, charts, and graphs.
The number of monitoring sites on the map fluctuates throughout the year. For example, DEQ’s Crop Residue Burning (CRB) Program operates seasonal monitors to assess agricultural burning practices.
DEQ also distributes air quality data to the following:
- EPA’s AirNow page—Provides air quality forecast and real-time AQI information.
- EPA’s AirNow fire map—Displays all of the monitoring sites, as well as emergency deployment monitors for wildfire smoke detection.
- DEQ’s Air Quality Forecasts page—Provides forecast information and associated response actions.


